Google Analytics reports can be overwhelming sometimes because of the abundance of data. Looking into insightful, relevant data is challenging even for tech-savvy folks, so considering non-technical users is complex. Web developers encounter clients who barely understand anything about Google Analytics, and usually, they don’t even have the time to invest. Most of the actions and decisions are based on raw data. The market is constantly changing, and every business or e-commerce website must be optimized. Whether landing page performance, conversion rate, bounces rate or goal completions – the list of engagement metrics is extensive, so it is advised not to spend time copying stats into an Excel spreadsheet. Instead, the software would do better by pulling numbers and creating Google Analytics reports instead.
Well, as known to all, experimentation is a good thing, and there’s no question that Google Analytics today is considered a top priority when it comes to client reporting. Research says almost 30 million live websites are using Google Analytics. The only drawback with Google Analytics report is non-technical people or clients would need some time to learn about its usage. As we know, the chances for clients to get lost in the numbers quickly can be very frustrating.
This is precisely where marketing expertise comes into play. Creating custom Google Analytics reports can get a clear picture and understanding of working and what is not. The ideal place to start is with Google Marketing Platform. From finding great templates to custom reports, it offers everything.
List of Custom Google Analytics Reports
Below is a list of five Google Analytics custom reports that provides value to most clients are:
Before diving deep into the reports, let’s have a brief overview of critical Google Analytics metrics. Essential Google Analytics Metrics are as follows. Google Analytics metrics can be further divided into the following three categories:
- Acquisition: Sessions: New Sessions, % of New Sessions, Behavior Metrics
- Behaviour: Bounce Rate, Pages per Session, Average Session Duration
- Conversion: Goal Completions, Goal Conversion Rate, Goal Value.
Customer Acquisition report
Needless to mention but the most crucial aspect of the thing that bothers most clients is inputting on customer acquisition. This report is designed to show clients where customers are coming from and which specific channels generate revenue. The data shared or a customer acquisition report includes the following inputs:
- Sessions
- % New Sessions
- Bounce Rate
- Revenue
- Average Order Value
- Conversion Rate
Device Comparison Report
A device comparison report is more critical today because the pattern of the search for information is changing. This report displays typically six data points for each type of device like desktop, mobile, and tablet, and these include:
- Sessions
- % New Sessions
- Bounce Rate
- Revenue
- Average Order Value
- Conversion Rate
When reviewing the device comparison report, it’s essential to ask yourself several questions such as:
- Which devices are driving the most traffic?
- Which devices have the highest bounce rate?
- Which devices have the highest revenue?
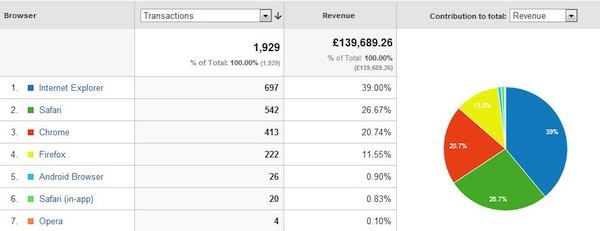
Browser Report
Many of the standard money leaks happening on websites are incompatibility problem with specific browsers. It is said that creating a custom report and showing conversions as per browser and segmenting reports by any device like mobile, desktop or tablet are done not to skew numbers. Every search engine links to a similar prepopulated account in an all-time list of time-saving customized reports. If you are not selling or promoting products on your website, one can easily swap out unique purchases and revenue for conversion and goal value-centric metrics. And not to mention, but don’t forget to segment by the device; it counts.
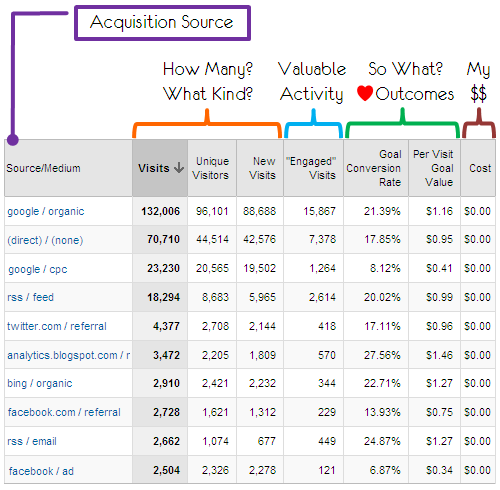
Visitor Acquisition Efficiency Analysis Report
This report aims to organize critical metrics; they usually reveal the performance and efficiency of each stream of traffic to a particular website. One can see the total number of sessions, new users, goal conversion rate, unique users, and goal value per session, organized by medium and source.
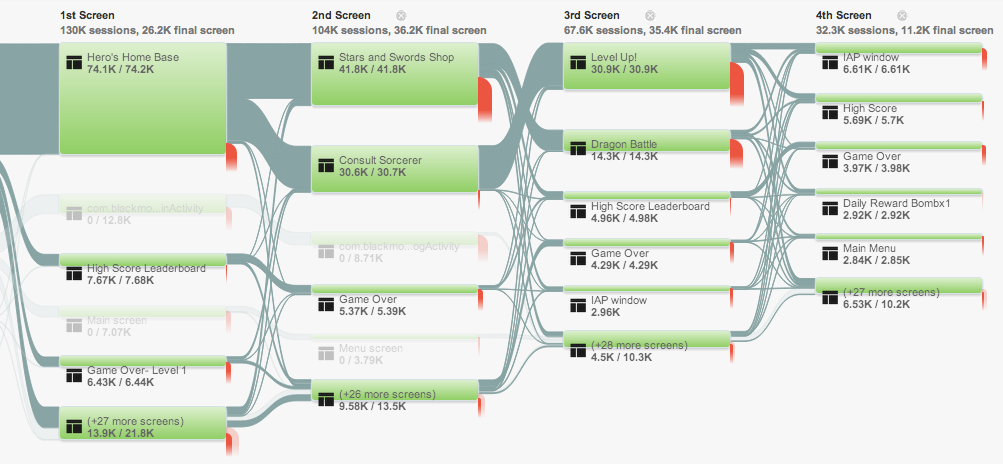
User Behavior Report
This report is about how behavior varies between new and old users. It measures the returning of users in regards to conversion pattern, event completion and overall traffic.
Mobile Performance Report
Ideally known for understanding how well a site is optimized for mobile and where an individual needs to work and improve.
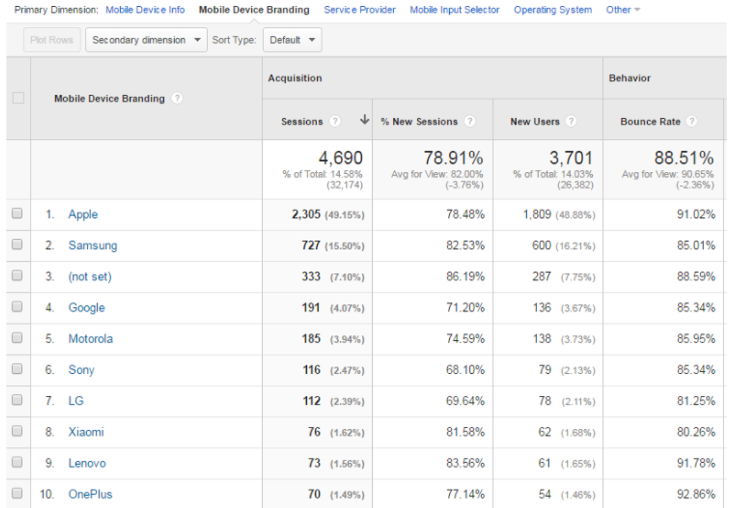
Here is a list of few more categories of reports:
- Organic Traffic Landing Page report
- Email Assessment report
- Time of Day/Day of Week report
- Browser report
- Customer Behavior report
- eCommerce Traffic report
- PPC Keywords report
- The content Efficiency Analysis report
Conclusion
To conclude, customized Google Analytics SEO reports are one of the most powerful tools in Analytics. The accounts shared above in the article are simple versions that will help to get clients started with eCommerce analytics. Depending on the nature of the business, feel free to alter them.


